Tesla safety report and accident statistics explained
Last updated 17-Jan-2023
We have updated this article a number of times over the years dating back to January 2019 after Tesla revealed their safety stats for 2018. As we enter 2023, we're updating it again as new data has been released, and we're going to explain the need for caution.
Tesla have changed what data they provide. They used to include 4 data points for each quarter, the accident rates in each of the following scenarios:
- All cars average
- Tesla cars with no Autopilot hardware, effectively the earliest cars
- Tesla cars with Autopilot when in passive mode, i.e. only the safety systems such as lane departure warnings active
- Tesla cars with Autopilot engaged
Tesla have now dropped the passive safety data from the report. We find this somewhat surprising, and we suspect this is linked to the removal of the radar from cars which played a key role in Automatic Emergency Braking (AEB), irrespective of its use in the Autopilot driver assist features.
When we look at the numbers, there are a number of key markers to look at. These include the trend of individual stats over time, taking into account seasonality, and the ratio of stats to other stats in the same quarter. It's also worth noting that Tesla is unlike most other reports in this area, the Tesla focus is on accident rates whereas other reports tend to focus of injury rates.
Trends over time
We will look at each statistic in turn.
United States Average
The US average statistic is just that, a statistic for how many accidents there have been measured by the average number of miles driven in the US between accidents, irrespective of weather, driver demographic, vehicle type, vehicle age, road type etc. The lower the number, the more frequent the accidents. There is some small fluctuation in this statistic, but it is only a small fluctuation and over the 4 years that the data has been shared by Tesla, the figure has remained pretty stable. The significance of this is that if this is a true in quarter average, then seasonality seems to make very little difference to the accident rate in general. We're somewhat surprised by this, but that is the data presented.
Tesla vehicles not using Autopilot Technology
We've had to go back and check the previous data Tesla supplied to confirm what this statistic relates to. From previous data releases, the data relates to cars with NO Tesla safety systems. These are the cars before even the introduction of the Mobileye hardware and the fleet is very small.
The reason we are so confident on the definition of this data is by revisiting the safety data from Q1 2021. This was the last period where Tesla released data for both passive safety and no safety features on its cars, and the data was >2M miles and <1M miles respectively, the latter of which correlates with the figures provided in the latest report for the same period.
These figures show great variability with some quarters worse than previous quarters. A small fleet does not skew the results in themselves, we are looking at averages, but they can skew the results due to having a small sample size, i.e. the potential variability is greater with a small sample, and as these cars represent only a few thousand Tesla's, a small variation in the number of accidents will reflect in a notable variation in the results.
However, what is interesting is that these figures have no safety features, so why they are 2x to 3x times better than the US all mile's figure? This cannot be as a result of any measure that Tesla have taken, certainly not with regard to technology. The better figures will largely relate to factors relating to the owners, i.e. a Tesla owner is likely to be a safer driver than the average, and we look at why this may be the case later.
Tesla vehicles with passive safety
This figure is no longer reported by Tesla. When these figures were last reported in Q1 2021, the data showed a doubling in distance driven between accidents in that quarter, however the long term average is about a 50% improvement over a number of years.
This is down to features such as lane departure warnings and Forward collision detection and emergency braking. These safety features have been added to cars across all makes over time, with differing models having some or all of the same features. There is widespread reporting on the improvements in car safety in newer designs, although much is geared to injury rather than accident rates. Tesla do not report on injury rates.
Over time, however, these figures had plateaued with no discernible upward trend in the later quarters. There is some seasonal variability between quarters, unlike the NHTSA all cars statistic, which points to a variability in performance of the passive safety systems due to time of year. There is also a hint that the trend is downwards, i.e. the cars are having accidents more frequently. We offer two possible explanations: The demographic of the Tesla owner is now changing, with more younger people buying due to cheaper Model 3 models, and this demographic has a higher risk profile than the earlier owners. The second possible explanation is the removal of the forward radar from cars which was heavily used in the passive safety systems. The removal of this may have reduced the effectiveness of the passive safety systems.
As previously mentioned, we are surprised that Tesla have stopped reporting these figures as we feel they are a useful gauge to the performance of their passive safety systems, something that we should be told given the removal of the radar.
Tesla vehicles with Autopilot engaged.
The figures with Autopilot engaged are significantly better than the other two reports. While there has been an improvement over time, the trend is only marginally upwards with some considerable variability. The FSD City Streets Beta programme in the US has also introduced some behavioural changes with owners. There is now a driving performance assessment built into the car, and owners wanting to be part of the programme need to score exceptionally well, this having a direct impact on their driving. Not all owners have purchased FSD and so this is not a blanket reason, just one of a number of factors.
Performance with respect to the other measures.
The numbers presented are on a fairly crude "miles per accident" basis. What we don't have is any context behind them other than say "miles with autopilot activated". The basis however is different, the NHTSA data is a count of accidents reported to the police, this will include minor fender benders, but equally may not include all minor bumps where the drivers simply exchange details and get on their way. The data for Tesla cars is where the airbag or safety restraint system has activated, these are significant impacts but do not include any minor collision. So what is clear is that the numbers, especially the active autopilot figure, are not on a like for like basis.
The numbers also don't tell the whole story because the Tesla figures represent subsets of the all miles driven figure from the NHTSA. Below we cover a number of these reasons:
Demographic of the owner
Tesla cars are not cheap and are likely to be bought by a mixture of older drivers or younger drivers in a professional occupation. There will of course be owners outside these demographics but for statistics, it's where the majority will be that we care about. The NHTSA statistics will of course cover all drivers as well as all cars.
On age alone. it is known that drivers between 35 and 60 are the lowest risk group and the age group we feel the majority of Tesla owners fall into. Insurance alone prohibits many under 25-year-olds driving a Tesla. The AAAFoundation data show that high 30's and above are 4x safer than the average. If this correlates with the typical Tesla demographic, then this statistic alone suggests a Tesla would record an accident every 2 million miles v the half million for all cars, something that Tesla are not achieving. This is not the only factor, and while we know Tesla's are driven across many age groups, we do believe that the majority are 30 years old or greater.
Studies have also shown that the level of education correlates to the accident rates. Education also correlates to the income of an individual, and income correlates to the ability buy a Tesla. In essence, the statistically you are more likely to have a slightly older, well-educated individual driving a Tesla, with a reasonably well paid job than the average, and these are all factors that lead to lower accident rates.
Road types
Active autopilot is used predominantly on Motorways/Freeways as this is the road type Tesla advise it is only suitable for. While it can now be used on other road types, and there is the FSD City Streets pilot, we believe the volume of miles driven under active Autopilot will be on this type of road. The FSDb programme clearly does not fit into this category, but the system also has a strikes system and disables drivers who do pay extremely close attention to the driving. The primary road type is known to be statistically safer than the average road.
UK figures from 2017 state that there were 99 fatalities in 69 Billion miles on motorways v 1068 in 145 Billion rural roads and 626 in 117 Billion urban miles. A reference to the above data can be found in this UK Government report.
Another reference is US Department for transportation road safety which shows interstate roads have approx. half the fatality rate compared to all roads) are all relevant factors when making meaningful comparisons.
Tesla compares accident (or crash) rates not fatality or injury rates, but logic dictates that on these faster roads an accident is more likely to result in an injury accident than slower roads because the speeds and therefore forces are greater. While exact numbers may be difficult to determine, the respective ratios of accident rates resulting in injury can be inferred.
The data therefore suggests that just based on the road type where Autopilot is typically engaged, you would expect to see a 2-4-fold increase in miles between accidents for no other reason that the location.
Junctions
Active cruise control cannot cater for a number of junction types (with the exception of the city streets beta). In part this is linked to the road type point above, but if travelling on a road where a traffic roundabout is present, traffic lights, right turns etc, the system has traditionally been disengaged and the driver takes control. In a similar way, over taking on a two-way road is something that the car will not attempt when on autopilot. These are the situations when most accidents occur. City Streets is starting to attempt these things, but the driver acts as a backup and we hear of many stories where the driver has to take over control. Tesla do not count a disengagement which would otherwise have caused as accident as a failure in the statistics, but in reality it is.
Weather and traffic
In a similar way to the road type, the use of active autopilot is typically skewed to better conditions and lighter traffic, with the exception of heavy stop start traffic. Every owner who has used Autopilot will have turned it off at times because the conditions meant the system could not cope. In a similar way, the same can be said for weather conditions. Few attempt to use autopilot in the snow, ice or fog, and all of these can be contributing factors to accident rates.
Tesla results trend to Q3 2022
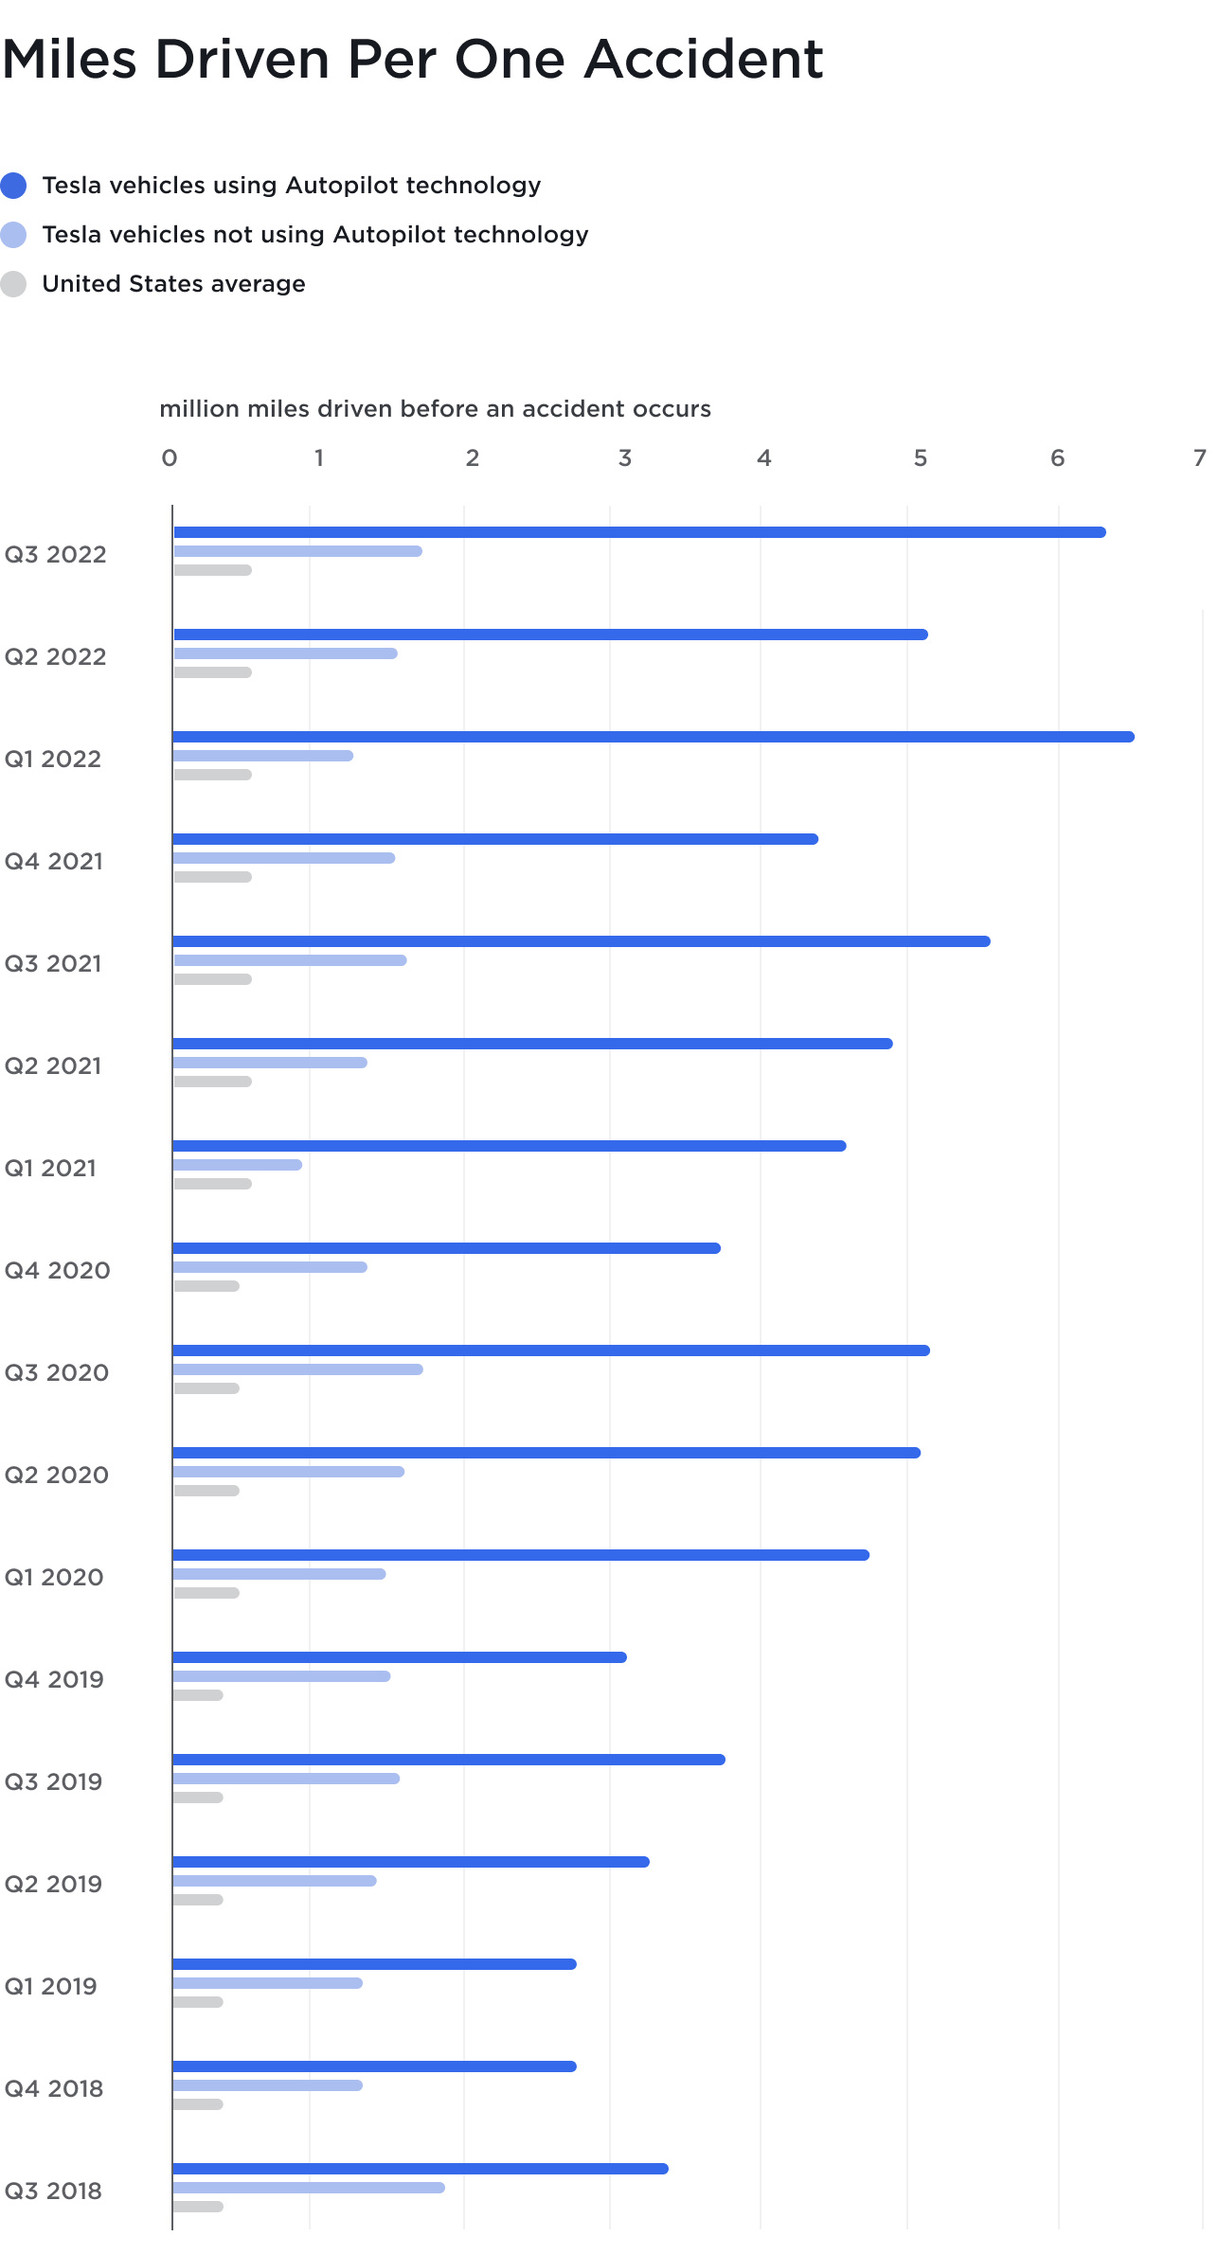
This is the data Tesla have published for results up to Q3 2022
The data involving Tesla's with no autopilot is now fairly redundant given the small sample size and age of the cars. The data needed is the Tesla's with Autopilot but in passive use, ie safety systems only.
Active autopilot has a very slight upward trend but not universal. Q3 2022 is worse than Q1 2022 which is surprising as Q1 is Winter. Q2 2022 is barely different to Q2 2021 and the same as Q2 2020. There is some uptick, but for all the development in the last 3 years, the numbers suggest maybe a 10% improvement each year at best.
Tesla results trend to Q4 2021
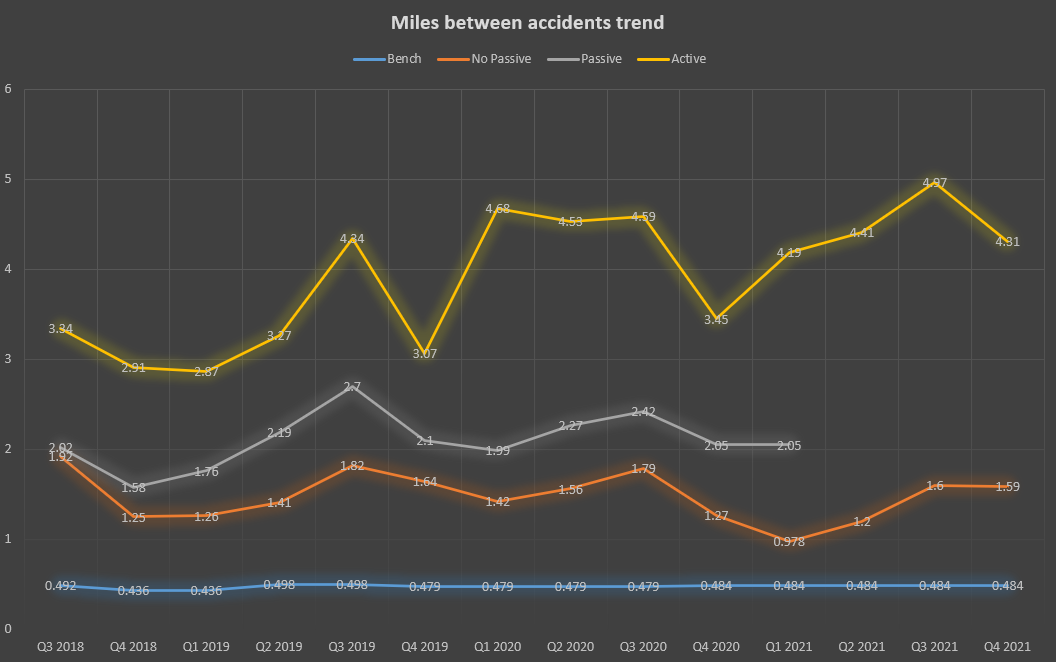
Let us first look at the NHTSAs statistics. While there is some fluctuation, the change year on year is relatively small with little seasonal adjustment.
If we look at the trend of accidents involving Tesla's with no AP features including no passive safety, we see fairly limited variability over time. There is some seasonality in the data, but 2021Q3 is slightly worse than the equivalent 2020 figure, whereas 2021Q4 is slightly better. We don't believe there is any material change going on.
Tesla have decided to stop reporting passive safety performance which we find as being very peculiar and potentially worrying.
Active autopilot has seen an improvement since 2019 however comparing 2020 to 2021 shows a mixed picture with some quarters better and other quarters worse than the equivalent quarter the year before. Without much more data it is hard to deduce any conclusions. There is arguably a very small improvement, could this be the increased number of cars with HW3 computers? Could this be because the nag system has tightened up on abuse? We simply don't know, but over the last 2 years we don't believe the figures suggest any significant increase in performance.
Conclusion
Well, in short, it's inconclusive, but there is a justified need for caution. There are variables that could more than explain away any performance increases shown in the data that are not related to the cars themselves. There is potentially even an argument that the cumulative nature of the explanatory figures shows that the cars on active autopilot are actually worse, and we are also concerned that Tesla have removed the one related statistic which would have been useful.
That said, it's good to see the willingness to release these figures, even if we suspect Tesla are being somewhat economical with the story telling. Unfortunately, the anti-Tesla people can find much to dispute the figures, whereas the pro Tesla lobby will take them at face value and claim they are evidence of Tesla's progress. We're somewhere between the two, the figures overstate the reality, but they're still good to see, we just wish there was more transparency and more of a scholarly presentation of the data that satisfied those, like ourselves, with a genuinely curious mind.