Tesla cost to change
Last updated 28-Nov-2022
Tesla depreciation can be looked at in a number of ways. You will hear many owners say their cars are worth virtually what they paid for them a year previously and in the case of some Model X owners they might quote they have only lost a few thousand in 3 years of ownership. It sounds great and you can find Tesla depreciation curves for most models in most countries, but it's worth taking a slightly closer look to understand what is going on as Tesla new prices have also being on the rise.
For each car that we include in our listings, we include a plot of that model/year and the average advertised price over time. Just take a look at any of the cars and you will see that chart with some other relevant plots to help understand the market. This depreciation plot is what many people consider to be the historic depreciation curve. The old saying that "past performance is not necessarily a guide to future performance" is in the strictest sense true, however with Tesla the position is a little more subtle.
Tesla have steadily increased the prices of their cars over time. As an example the Model X 75D was a relative bargain when it was launched, and while it is not in production today, when it was stopped being sold it had increased in price by a fair degree which helped hold up the values of the cars people had bought. While the headline historic depreciation is therefore great, the ability to replace the car for a similar but newer car is not so easy.
Options on cars have historically always been a mixture of either essential must haves, without which the cars used market is limited, or worth nothing on the resale market. The larger alloy wheels on the Model S and Model X have little resale value compared to their option price and indeed some prefer the smaller wheels, and full self driving is also worth only a fraction of it's current purchase price (although many sellers will historically only paid a fraction of the current price as it has been discounted quite heavily in the past). Tesla in general now have few options other than the autopilot hardware and colour, although on there are some options which make the car easier to sell, tow bar on the Model 3 being an example.
As mentioned, to see the historic depreciation curve for any particular model, simply find the nearest car in our inventory listings and we will display that plot for you. The rest of this article is focused on the second aspect of depreciation which we call the "cost to change". In essence, this is the cost to replace a car with a newer version of a similar position in the range.
How we calculate depreciation and the cost to change
This alternative view of depreciation is looking at the replacement cost, or the cost to change from a car to a newer but equivalent model. Models have not stayed the same over time but we have taken the Model S and Model X Long Range car and the equivalents over time, namely the 90D and 100D. We have done similar with the performance models. While these cars reflect essentially the same point in the Tesla offering, the cars have also become better equipped with longer range and more features bundled in as standard, however the point still holds that if you currently have a 2 year old 100D and wanted to buy a new model, you would need to buy the Long Range+, and its this comparative price that we are considering.
US depreciation charts
The date we are using is from the US and taken in mid 2020 while the outgoing versions of the Model S and Model X were still available internationally.
The data also represents only cars for sale by Tesla, either as Tesla used/cpo or new. The dates are the factory dates for the specific cars.
We have not tried to correct for mileage or features, and of course this can have a bearing on the results.
The data since then has become more complicated due to Covid and the delays in bringiong the updated Model S and Model X to market which has meant anybody in the market for these cars have no choice but to go to the used market or wait for delivery which is currently limited and for the Model S only.
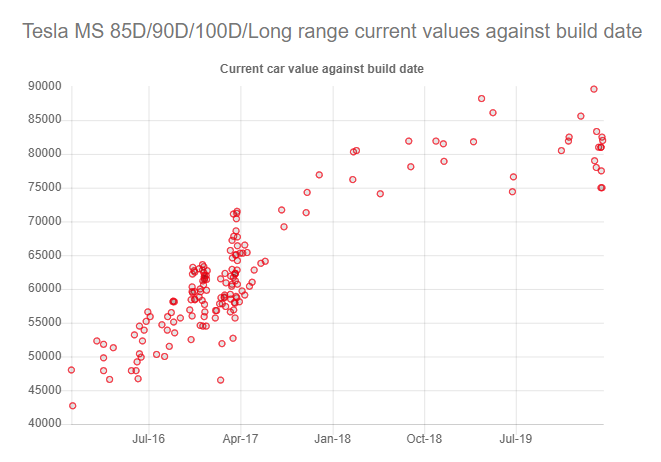
MS Long Range
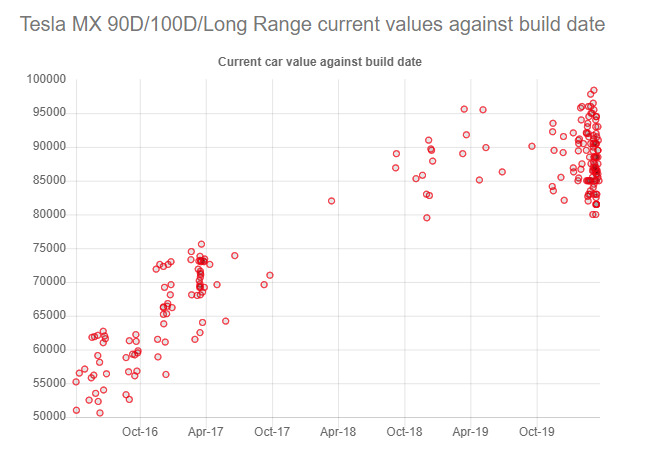
MX Long Range
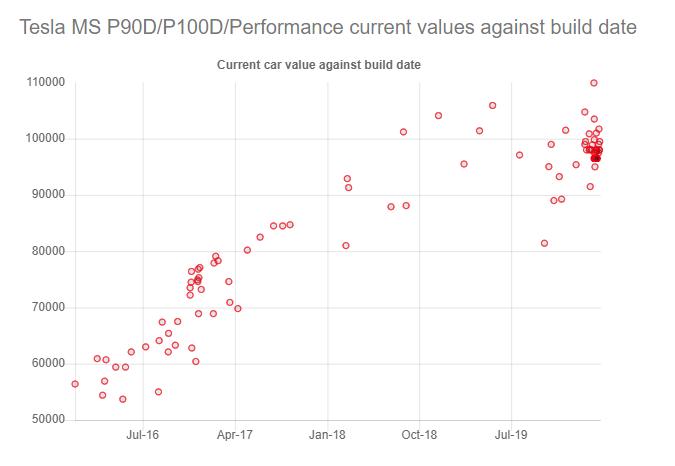
MS Performance
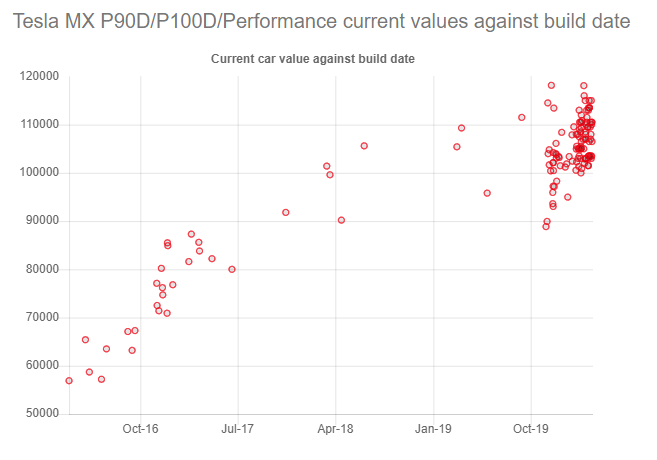
MX Performance
Findings
In general the charts show a high volume of cars around 3 years old which would correlate with 3 year finance deals ending and the cars being returned to Tesla. While pre April 17 peaks could also be indicative of the removal of free transferable supercharging that occurred around that time, the data is looking at build dates not registration dates.
If we take a crude fit through the data, in each case a 4 year old car is currently worth about half the price of a new car. That is not to say those older cars have depreciated to half, but that the cost to change to the modern equivalent would only be half covered by the value of a 4 year old car.
Depreciation is otherwise relatively flat with if anything following the opposite to a classic depreciation curve. One would normally expect cars to depreciate fairly quickly from new, and the depreciation slowing down as cars get older. The data suggests there is good support for newer cars with older technology and/or the expiry of the 4 year warranty approaching resulting in a slightly accelerating depreciation.